How to Draw Shear Force and Bending Moment Diagrams, Step by Step
These two diagrams show exactly where a beam works hardest. Learn to draw them step by step and find the spot where a beam is most likely to fail.
On this page
How to Draw Shear Force and Bending Moment Diagrams, Step by Step
What are these diagrams?
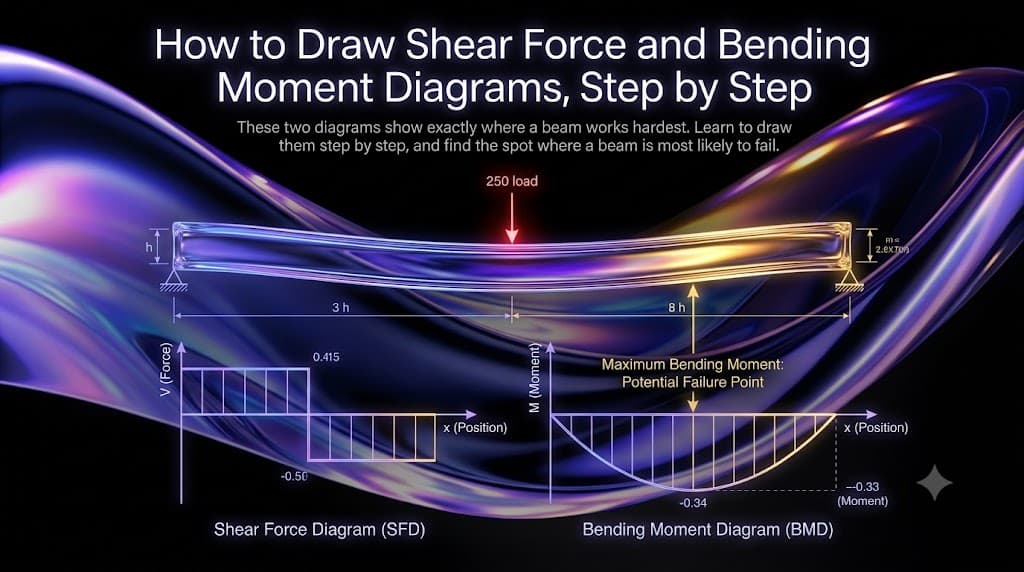
A shear force diagram shows the internal shear force along the length of a beam. A bending moment diagram shows the internal bending moment along the same beam.
Together they map how hard a beam is working at every point. The shear diagram tells you where the beam is being sliced across, and the bending diagram tells you where it is being bent the most. That bending peak is usually where the beam is closest to failing, so these two diagrams tell you where to add material and where a beam will break. They are a rite of passage in every mechanics course for exactly that reason.
Why they matter
A beam does not fail evenly along its length. It fails where the internal forces are highest, and those are almost never at the ends.
Without these diagrams you are guessing where the danger is. With them, you can read the exact location of the largest bending moment, size the beam for that spot, and avoid wasting material everywhere else. Every floor joist, bridge girder, and machine shaft is sized this way.
Building it from first principles
The trick behind both diagrams is simple: cut the beam.
Imagine slicing the beam at some point and looking at the piece to one side. For that piece to stay still, an internal shear force and an internal bending moment must act at the cut. You find them by balancing the forces and moments on the piece.
- Shear force at a cut is the sum of all vertical forces on one side of it.
- Bending moment at a cut is the sum of all moments on one side of it.
Slide the cut along the beam and record these values, and you have drawn both diagrams.
The steps
The method is always the same.
- Find the reactions. Start with a free body diagram of the whole beam and solve for the support reactions.
- Work along the beam, section by section, between each load and support.
- Sum vertical forces on one side of each section to get the shear.
- Sum moments on one side to get the bending moment.
- Plot both underneath the beam, lined up with its length.
If you are shaky on step one, our free body diagrams guide covers it.
A useful shortcut
The two diagrams are linked, and knowing how saves time and catches errors.
- The shear diagram is the slope of the moment diagram. Where shear is zero, the bending moment is at a peak.
- A point load makes the shear jump straight down. A uniform load makes it slope.
So the fastest way to find the maximum bending moment is to look for where the shear crosses zero. That crossing point is almost always where the beam is working hardest.
💡 Rule of thumb: the maximum bending moment sits where the shear force crosses zero. Find that point and you have found the danger spot.
A quick worked example
A beam of length 4 metres rests on supports at both ends, with a load of 10 kilonewtons in the middle.
- Reactions. The load is central, so each support carries half, 5 kilonewtons up.
- Shear. From the left, the shear is a steady 5 until the middle, where the load drops it to minus 5. It crosses zero exactly at the centre.
- Bending moment. It rises from zero at the support to a peak right at the centre, where the shear crossed zero, then falls back to zero at the far support.
The peak moment at the centre is what you size the beam for.
Common beginner mistakes
- Skipping the reactions and starting the diagrams too early
- Losing track of sign conventions halfway along
- Forgetting that a point load causes a sudden jump in shear
- Not lining the diagrams up under the beam
- Missing that the moment peaks where shear is zero
Interview questions
These come up because they show whether you understand what is happening inside a beam. Here is what interviewers want.
"What does a shear force diagram tell you?" How the internal shear varies along the beam, found by summing vertical forces on one side of each section.
"Where is the bending moment largest, and why does that matter?" Where the shear crosses zero. It matters because that is usually where the beam is most stressed and most likely to fail.
"What is the relationship between the two diagrams?" The shear is the slope of the bending moment. Where shear is zero, the moment is at a maximum or minimum.
"How does a point load appear on a shear diagram versus a uniform load?" A point load causes a sudden vertical jump. A uniform load causes a straight sloping change.
Quick reference
| Quantity | How to find it | On the diagram |
|---|---|---|
| Shear force | Sum vertical forces on one side | Jumps at point loads, slopes under uniform loads |
| Bending moment | Sum moments on one side | Peaks where shear crosses zero |
| Max moment | Look where shear is zero | The beam's danger point |
Key takeaways
If you remember five things, make it these.
- Shear and moment diagrams map where a beam works hardest along its length.
- Both come from cutting the beam and balancing the piece on one side.
- Always find the reactions first.
- The maximum bending moment is where the shear crosses zero.
- Size the beam for that peak moment, not for its ends.
Practice on FixtureLabs
Drawing these smoothly takes reps. On FixtureLabs, work through beams with different loads and supports, and check your shear and moment diagrams against the answer every time.
Written by
FixtureLabs Inc.
FixtureLabs Inc. writes about fixture design, GD&T and how modern teams pair classical mechanical engineering with AI.